6/09/2019

Flume with Docker


Use case

Send file through TCP to Flume and log content in the console.
  • Assumptions: Docker already installed

Steps


1. Clone below github project.

https://github.com/dhanuka84/docker-flume

2. Build docker image using following command

docker build -t my-flume-image .

3. Change configuration in following folder according to your local machine.

config/*
run-fl.sh

4. Execute bash script

sh run-fl.sh

5. Send file through TCP tunnel

netcat localhost 4444 < README.md

6. Output from docker container


References:


1. https://flume.apache.org/releases/content/1.8.0/FlumeUserGuide.html
2. https://github.com/mrwilson/docker-flume
3. https://blog.probablyfine.co.uk/2014/08/24/using-docker-with-apache-flume-2.html


2/09/2019

Rule Execution as Streaming Process with Flink


As explained in the above diagram, rule creator (Desktop) will create JSON based rule and push them to Kafka (rule topic). Event Source will send events to Kafka  (testin topic). Finally Flink will consume both rules and events as streams and process rules based on key (Driver Id). Rules will be stored in Flink as in-memory collection and the rules also can be updated in same manner. Finally out put result will be send to Kafka (testout topic).


Setup Flink


  • Download Apache Flink 1.6.3 from below location and extract archive file.

          https://www.apache.org/dyn/closer.lua/flink/flink-1.6.3/flink-1.6.3-bin-scala_2.11.tgz


  • Download below dependancy jar files and place in flink-1.6.3/lib folder.


  • Configure Flink with flink-1.6.3/conf/flink-conf.yaml .


         Change job-manager and task-manager heap size to much smaller size.

         jobmanager.heap.size: 1g
         taskmanager.heap.size: 2g
         taskmanager.numberOfTaskSlots: 20

  • Change State Backend to RocksDB

          Create folder from you home location

         ~$ mkdir -p data/flink/checkpoints

          Edit configuration

          state.backend: rocksdb
          state.checkpoints.dir: file:///home/dhanuka/data/flink/checkpoints


  • Start Flink cluster in standalone mode.

           :~/software/flink-1.6.3$ ./bin/start-cluster.sh

Setup Kafka & Zookeeper


  • In here I am using docker and docker compose so you can follow below blogspost to install docker & docker-compose in ubuntu.

          http://dhanuka84.blogspot.com/2019/02/install-docker-in-ubuntu.html


  • Please checkout below docker project from github.

          https://github.com/dhanuka84/my-docker.git 


  • Change IP address to your machine IP address.

         https://github.com/dhanuka84/my-docker/blob/master/kafka/kafka-hazelcast.yml


  • Bootup Kafka and Zookeeper with docker-compose
          my-docker/kafka$ sudo docker-compose -f kafka-hazelcast.yml up


  • Check docker containers


  • Create Kafka Topics

         Download Confluent Platform - https://www.confluent.io/download/

  • Got to confluent platform extracted location and run below commands


bin/kafka-topics  --create --zookeeper localhost:2181 --replication-factor 1 --partitions 6 --topic  testin
bin/kafka-topics  --create --zookeeper localhost:2181 --replication-factor 1 --partitions 6 --topic  testout
bin/kafka-topics  --create --zookeeper localhost:2181 --replication-factor 1 --partitions 6 --topic  rule

Create Java based Rule Job


  • Checkout the project from github and build the project with maven.

          https://github.com/dhanuka84/stream-analytics
       
          stream-analytics$ mvn clean install -Dmaven.test.skip=true


          Please note that both rules and events filter by key.
         
          KeyedStream<Event, String> filteredEvents = events.keyBy(Event::getDriverID);
          rules.broadcast().keyBy(Rule::getDriverID)

          Store rules in ListState using flatMap1 method.
          Execute rule against  each relevant event using flatMap2 method.

          Finally results transform to JSON string.
  • Prepare flat jar to upload, using below command within checked out project home.

stream-analytics$ jar uf target/stream-analytics-0.0.1-SNAPSHOT.jar application.properties consumer.properties producer.properties

  • Upload Flink Job Jar file
         copy stream-analytics-0.0.1-SNAPSHOT.jar Flink home folder and run below command

         bin/flink run stream-analytics-0.0.1-SNAPSHOT.jar

Testing

  • Run Producer.java class using your favorite IDE. This will generate both events and rules then publish to Kafka.
  • To verify from Kafka level use below commands within confluent home location.


Get offset

bin/kafka-run-class kafka.tools.GetOffsetShell --broker-list localhost:9092 --topic testout  --time -1

 Read from Kafka topic
bin/kafka-console-consumer --bootstrap-server localhost:9092 --topic testout

2/08/2019

Install docker in Ubuntu

1. Go to below link
https://download.docker.com/linux/ubuntu/dists/xenial/pool/stable/amd64/

2. Download below debian installations
docker-ce-cli_18.09.1_3-0_ubuntu-xenial_amd64.deb
containerd.io_1.2.2-1_amd64.deb
docker-ce_18.09.1_3-0_ubuntu-xenial_amd64.deb


3. Install using below command
sudo dpkg -i /path/to/package.deb

4. Download docker-compose

curl -L https://github.com/docker/compose/releases/download/1.23.2/docker-compose-`uname -s`-`uname -m` -o /usr/local/bin/docker-compose


5. Make docker-compose executable
sudo chmod +x /usr/local/bin/docker-compose

6. Check Versions
docker --version
docker-compose --version

7. Check whether docker running

service docker status


8. Use Docker as normal user

sudo systemctl stop docker
sudo usermod -aG docker ${USER}
su - ${USER}
sudo systemctl start docker
sudo systemctl enable docker


11/24/2018

Elasticsearch : Factors Need To Consider To Get Rid Of From OOM


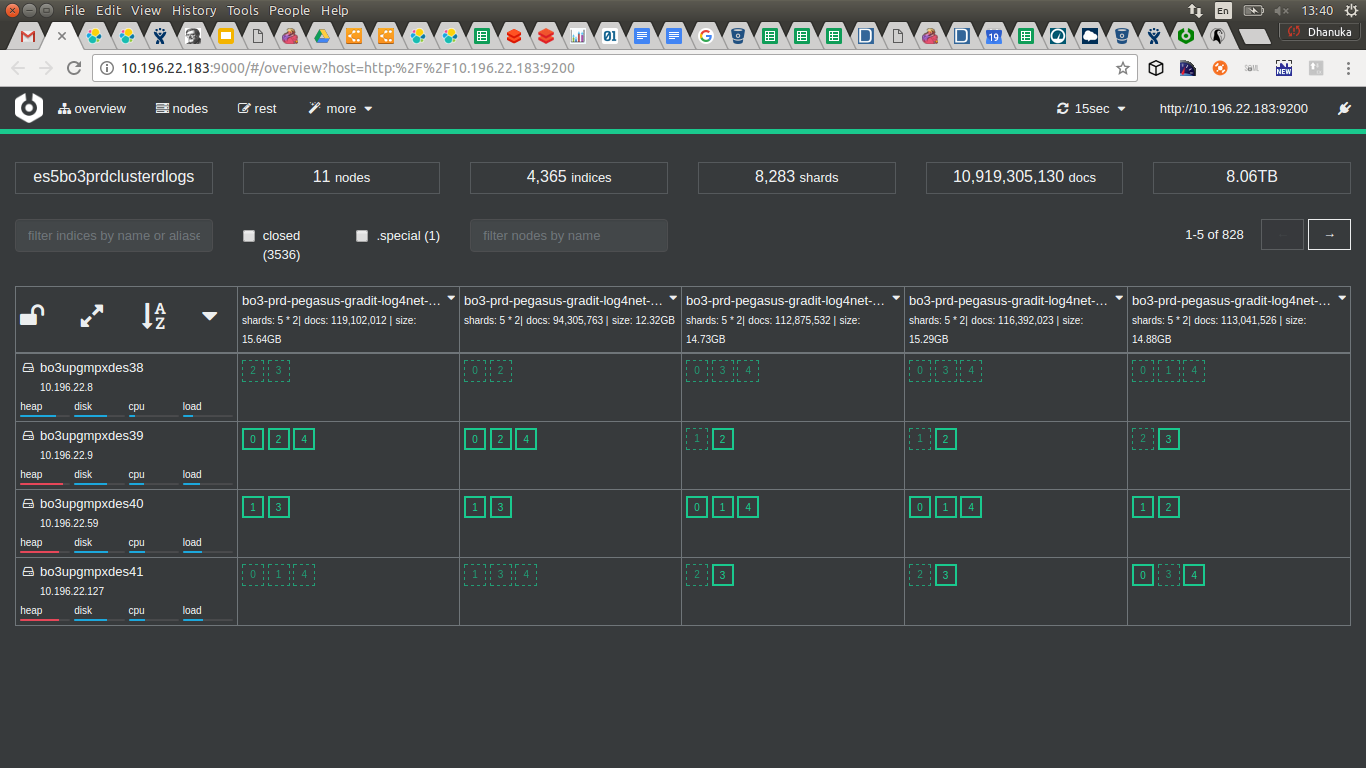
We used Elasticsearch as centralize logging system for multiple products.

Observations:

1. 8283 primary shards
2. 10 Billion documents
3. 8.06 TB of data in each data node
4. 4365 indices
5. Five primary shards per index
6. Four Data Nodes
7. Three out of four data nodes heap memory in critical state.


Identified drawbacks

  1.  Use daily index creation for even 1GB size indexes. 
  2. The default primary shard count for every index is 5. 
  3. For 12 different indices, number of primary shards will be as follows.


(primary shard per index) * 12 (number of indexes/ products) * 30 (days per month) = 1800


(3 months) 1800 * 3 = 5400
(6 months) 1800 * 6 = 10800


Improvements

  1. Use monthly index creation or create index more configurable manner based on the primary shard size.

Note: According to Elastic , recommended size of a primary shard is 30GB - 40GB (depend on network bandwidth)
       number of shards per node below 20 to 25 per GB (roughly each primary shard cost 40 MB of heap memory)


5 * 6 * 11 + 5 * 30  = 480 (No of primary shards count)


Improvement = 10800/480 = 22.5 times


Clear some misunderstanding


According to Elastic these are the ratio between RAM & Storage for two main purposes (reading & writing).

 For memory-intensive search workloads, more RAM (less storage) can improve performance. Use high-performance SSDs drives
 and a RAM-to-storage ratio for users of 1:16 (or even 1:8). For example, if you use a ratio of 1:16, a cluster with 4GB of RAM will 
get 64GB of storage allocated to it.

For logging workloads, more storage space can be more cost effective. Use a RAM-to-storage ratio of 1:48 to 1:96, as data sizes are 
typically much larger compared to the RAM needed for logging. A cost effective solution might be to step down from SSDs to spinning
 media, such as high-performance server disks. For example, if you use a ratio of 1:96, a cluster with 4GB of RAM will get 384 of 
storage allocated to it.
 
If we take one of our ES based centralize Logs cluster in production it’s working fine for 8.5 TB data just for 25GB RAM in data nodes.
 So according to Logs Cluster, RAM to Disk ratio is as 1:348. Also when we check number of primary shards it’s > 7000 .
How can this happen, so Logs even work with less RAM??
Highest contribution made by one of the product logs, roughly daily index size is 30 GB. Most of other products generate less than
 2 GB size of daily indexes.
As we all know , the Logs Cluster query load is really low compared to logs writing frequency.Having said that , If we take biggest 
logs contribution product logs writing frequency it’s 
something around 600 per second.
This is really low log writing load. According to my understanding normal workload should be 10000 per second
So Elastic give recommendation keeping these workloads in mind, where our case this is really low situation and that’s why we still
 can live with current  RAM to Storage ratio.
References:


7/15/2018

Short Notes: Design Principles & Patterns

History

The book called “A Pattern Language”[1]  by C.Alexander is the fundamental reference for the book named “Design Patterns (GoF)”, which is generally accepted as the standard in building software.

[1] https://en.wikipedia.org/wiki/A_Pattern_Language

A pattern language [2] is a method of describing good design practices or patterns of useful organization within a field of expertise.

[2] https://en.wikipedia.org/wiki/Pattern_language

Architectural Concepts

Envision - Examine stakeholder goals combined with architect’s expertise.
Model - View the ‘lay of the land’ to construct a model  and set expectations.
Blueprint - Specify the construction details  and constraints.
Inspect - Verify construction implementation.
Term Nomenclature - communicate  in terms understandable to listeners.

Mapping to software field

Envision - Software Architecture
Model - Design Patterns
Blueprint - Construction & Design principles 
Inspect - Construction patterns
Nomenclature - Terms to communicate intent


Software Architecture

Web server - A pipeline architecture
SOA - A component architecture
Client/Server - A layered architecture
Single Tier - Monolithic Architecture
Cloud - A tier network architecture

Design Patterns

Creational
Structural & Behavioral
Event Driven
Plugins

Design Principles

Abstraction
Encapsulation
Cohesion
Coupling
Complexity

Construction Patterns

Inheritance Design
Component Design
Layered Design
Tier Design
Delivery methodology
Software Architecture erosion (“Decay”)

OO Basics

Abstraction
Encapsulation
Polymorphism
Inheritance

OO Principles

  • Encapsulate what varies - Identify different behaviors
  • Favor composition over inheritance
  • Program to interfaces, not implementation
  • Strive for loosely coupled designs between objects that interact.
  • Open Close : Class should be open for extension but close for modification.
  • Dependency Inversion : Depend upon abstraction. Do not depend upon concrete classes.
  • Least Knowledge : Talk only to your immediate friends.

OO Patterns

What is a pattern : A reusable solution to a problem which occurring in a particular context.

Structure of a pattern

Name
Context - situation
Problem
Forces
Solution
Resulting Contex -  1. Benefits 2. Drawbacks 3. Issues to resolve
Related Patterns

Three fundamental groups

https://www.gofpatterns.com/design-patterns/module2/three-types-design-patterns.php


Behavioral patterns - Describe interactions between objects

  • Interpreter pattern -

Creational- Make objects of the right class for a problem

  • Factory vs Abstract Factory
  • Singleton-


Structural- Form larger structures from individual parts, generally of different classes.