Showing posts with label ElasticSearch. Show all posts

1/19/2020

Elasticsearch Hot Warm Cold Setup


We are going to deploy one master node, one  hot data node, warm data node, cold data node and one kibana node in same local machine. Then we play with Index Life Cycle Management UI.

Steps:


1. Clone below github project and go to cloned directory


https://github.com/dhanuka84/es-hot-warm-cold.git

2. You need to change my local machine configurations according to your machine


Local IP: 192.168.0.114
Project Folder: /home/dhanuka/research/elastic/docker2/es-hot-warm-cold/

How to change:  Use below linux command to replace all

find ./ -type f -exec sed -i 's/192.168.0.114/new_ip/g' {} \;

find ./ -type f -exec sed -i 's#home/dhanuka/research/elastic/docker2#new_folder#g' {} \;

Install Docker :

http://dhanuka84.blogspot.com/2019/02/install-docker-in-ubuntu.html

Change system settings: Run below command in terminal

sudo echo "vm.max_map_count=262144"  >> /etc/sysctl.conf

3. Run run-all.sh script as below

sh run-all.sh

You can check terminal output with nohup.out file

4. Then login to kibana as below.


5. Then go to monitoring tab

You can see number of Elasticsearch and Kibana nodes with their status.


6. Now let's create ILCM policy


Go to management tab and click index lifecycle policies as below.


7. Let's create policy as shown above and below.

In here we will create hot, warm , cold and delete phases of an index life cycle 


8. Then you need to create a index template as below.


PUT _template/my_template
{
  "index_patterns": ["kibana_sample_data*"],
  "settings": {
    "index.routing.allocation.require.my_node_type": "hot"
  }
}

9. Finally you need to add previously created ILCM policy to index template as below


10. Now when ever you create new index based on that template , ILCM policywill be applied to that index. You can verify template as below.


Request : 

GET _template/my_template

Response:

{
  "my_template" : {
    "order" : 0,
    "index_patterns" : [
      "kibana_sample_data*"
    ],
    "settings" : {
      "index" : {
        "lifecycle" : {
          "name" : "hotwarm-policy",
          "rollover_alias" : "my_index_alias"
        },
        "routing" : {
          "allocation" : {
            "require" : {
              "my_node_type" : "hot"
            }
          }
        }
      }
    },
    "mappings" : { },
    "aliases" : { }
  }
}


11/24/2018

Elasticsearch : Factors Need To Consider To Get Rid Of From OOM


We used Elasticsearch as centralize logging system for multiple products.

Observations:

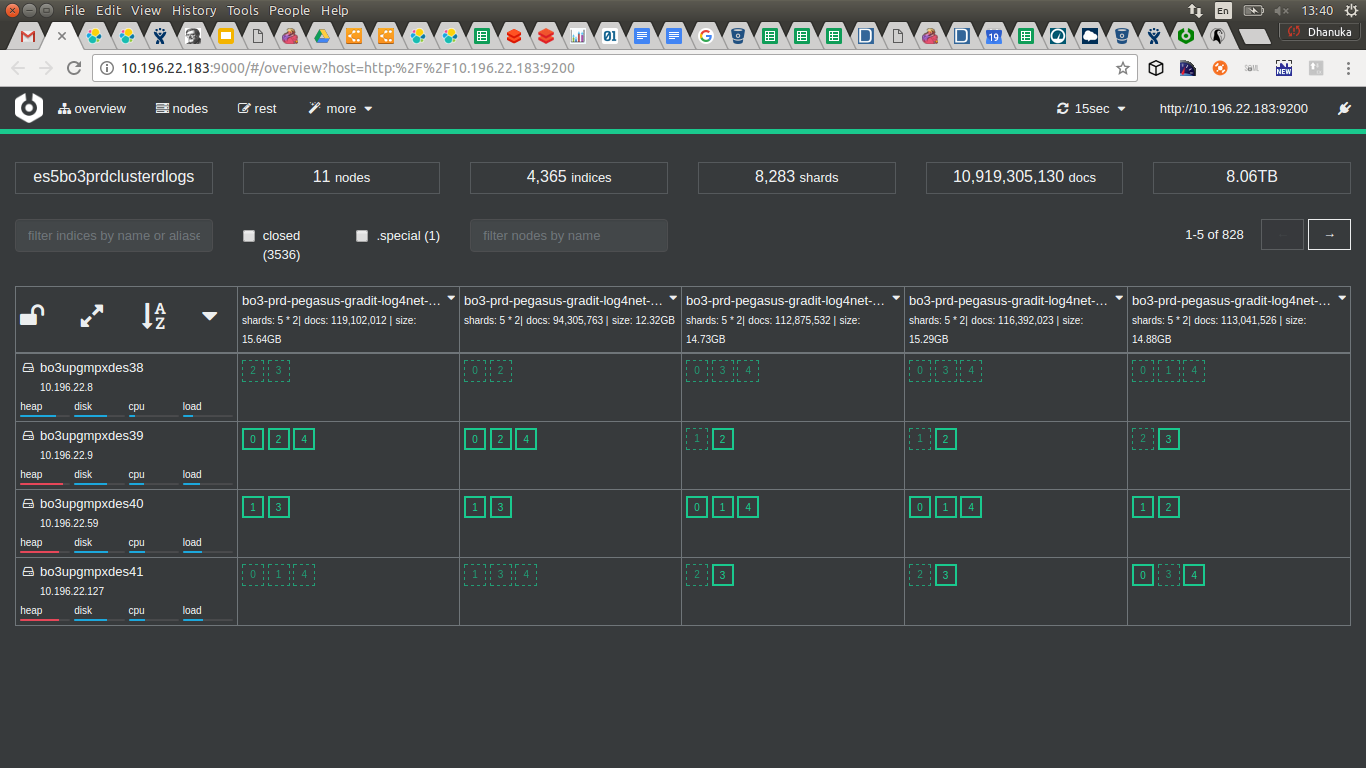
1. 8283 primary shards
2. 10 Billion documents
3. 8.06 TB of data in each data node
4. 4365 indices
5. Five primary shards per index
6. Four Data Nodes
7. Three out of four data nodes heap memory in critical state.


Identified drawbacks

  1.  Use daily index creation for even 1GB size indexes. 
  2. The default primary shard count for every index is 5. 
  3. For 12 different indices, number of primary shards will be as follows.


(primary shard per index) * 12 (number of indexes/ products) * 30 (days per month) = 1800


(3 months) 1800 * 3 = 5400
(6 months) 1800 * 6 = 10800


Improvements

  1. Use monthly index creation or create index more configurable manner based on the primary shard size.

Note: According to Elastic , recommended size of a primary shard is 30GB - 40GB (depend on network bandwidth)
       number of shards per node below 20 to 25 per GB (roughly each primary shard cost 40 MB of heap memory)


5 * 6 * 11 + 5 * 30  = 480 (No of primary shards count)


Improvement = 10800/480 = 22.5 times


Clear some misunderstanding


According to Elastic these are the ratio between RAM & Storage for two main purposes (reading & writing).

 For memory-intensive search workloads, more RAM (less storage) can improve performance. Use high-performance SSDs drives
 and a RAM-to-storage ratio for users of 1:16 (or even 1:8). For example, if you use a ratio of 1:16, a cluster with 4GB of RAM will 
get 64GB of storage allocated to it.

For logging workloads, more storage space can be more cost effective. Use a RAM-to-storage ratio of 1:48 to 1:96, as data sizes are 
typically much larger compared to the RAM needed for logging. A cost effective solution might be to step down from SSDs to spinning
 media, such as high-performance server disks. For example, if you use a ratio of 1:96, a cluster with 4GB of RAM will get 384 of 
storage allocated to it.
 
If we take one of our ES based centralize Logs cluster in production it’s working fine for 8.5 TB data just for 25GB RAM in data nodes.
 So according to Logs Cluster, RAM to Disk ratio is as 1:348. Also when we check number of primary shards it’s > 7000 .
How can this happen, so Logs even work with less RAM??
Highest contribution made by one of the product logs, roughly daily index size is 30 GB. Most of other products generate less than
 2 GB size of daily indexes.
As we all know , the Logs Cluster query load is really low compared to logs writing frequency.Having said that , If we take biggest 
logs contribution product logs writing frequency it’s 
something around 600 per second.
This is really low log writing load. According to my understanding normal workload should be 10000 per second
So Elastic give recommendation keeping these workloads in mind, where our case this is really low situation and that’s why we still
 can live with current  RAM to Storage ratio.
References:


5/28/2018

Complete Solution for SQL Based Real Time Streaming Analytics & Machine Learning


This hypothetical and high level architecture diagram will explain how we can use OSS technologies more effectively. We are going to discuss about this whole solution under four main subject areas.

  1. Distributed Streaming Message Broker (Data Pipeline)
  2. Streaming ETL & Streaming Aggregation
  3. Time Series Data Storing & ML Processing
  4. Dashboard & Notification 

Distributed Streaming Message Broker

We use Kafka as our data pipeline, you can get more details about Kafka from here [1] .
Kafka is proven technology which perform as distributed streaming log. Using it's partitioning technique we can scale up easily. It's perfectly ideal for event driven architecture because it's streaming nature. Kafka make it much more likely that disk access is often sequential and it utilized OS page cache efficiently [2].

Streaming ETL & Streaming Aggregation

Flink will be the stream processing platform that we use for aggregation, ETL and CEP. Flink by-design support stream processing and it's widely use streaming technology at the moment. Flink is based on the DataFlow model which means, Flink is processing the elements as and when they come rather than processing them in micro-batches (which is done by Spark streaming).

Uber AthenaX is a SQL based streaming analytics framework [3]. It's combination of YARN , Calcite & Flink. AthenaX give APIs to monitor, access & administrate life cyclone of Flink Jobs. Also because of Calcite we can write SQL based stream processing applications and run them inside AthenaX easily.

Time Series Data Storing & ML Processing

We use Cassandra as time series data storage. Cassandra architecture is ideal for this purpose because of sequential writing to disk, which will help for fast reading large set of data.

So the time series prepared data we got from streaming analytics platform, will be stored in Cassandra for machine learning.

We will train several ML models using prepared data, then trained models/knowledge base will be stored (as binary) in Cassandra.This way we can dynamically select trained models when we analyze real time data.

Spark slave/worker and Cassandra will reside in same host, and both will be connected by Spark-Cassandra-Connector. For high availability there will be active and stand by Spark master while Zookeeper keep the state of each master.

The main advantage of this approach is  guarantee of data locality between Cassandra node and Spark slave, which will cause for high performance data fetching.

Dashboard & Notification

Finally you need to store analyzed data for later use (Dashboard & trend analysis). Say for example, If we use this solution for predictive analysis, you can save predicted data in ElasticSearch. By using ELK stack, people can create Dashboards easily using analysis data with Kibana.

Also there are lot of other features in ElasticSearch & Kibana such as ES alerts, Trend analysis, Searching and etc...


References:

[1] https://kafka.apache.org/
[2] https://stackoverflow.com/questions/45751641/how-does-kafka-guarantee-sequential-disk-access
[3] https://eng.uber.com/tag/athenax/
[4] https://www.infoq.com/presentations/uber-ml-architecture-models?utm_source=infoqemail&utm_medium=ai-ml-data-eng&utm_campaign=newsletter&utm_content=05152018


5/20/2018

Event Sourcing for Micro Services


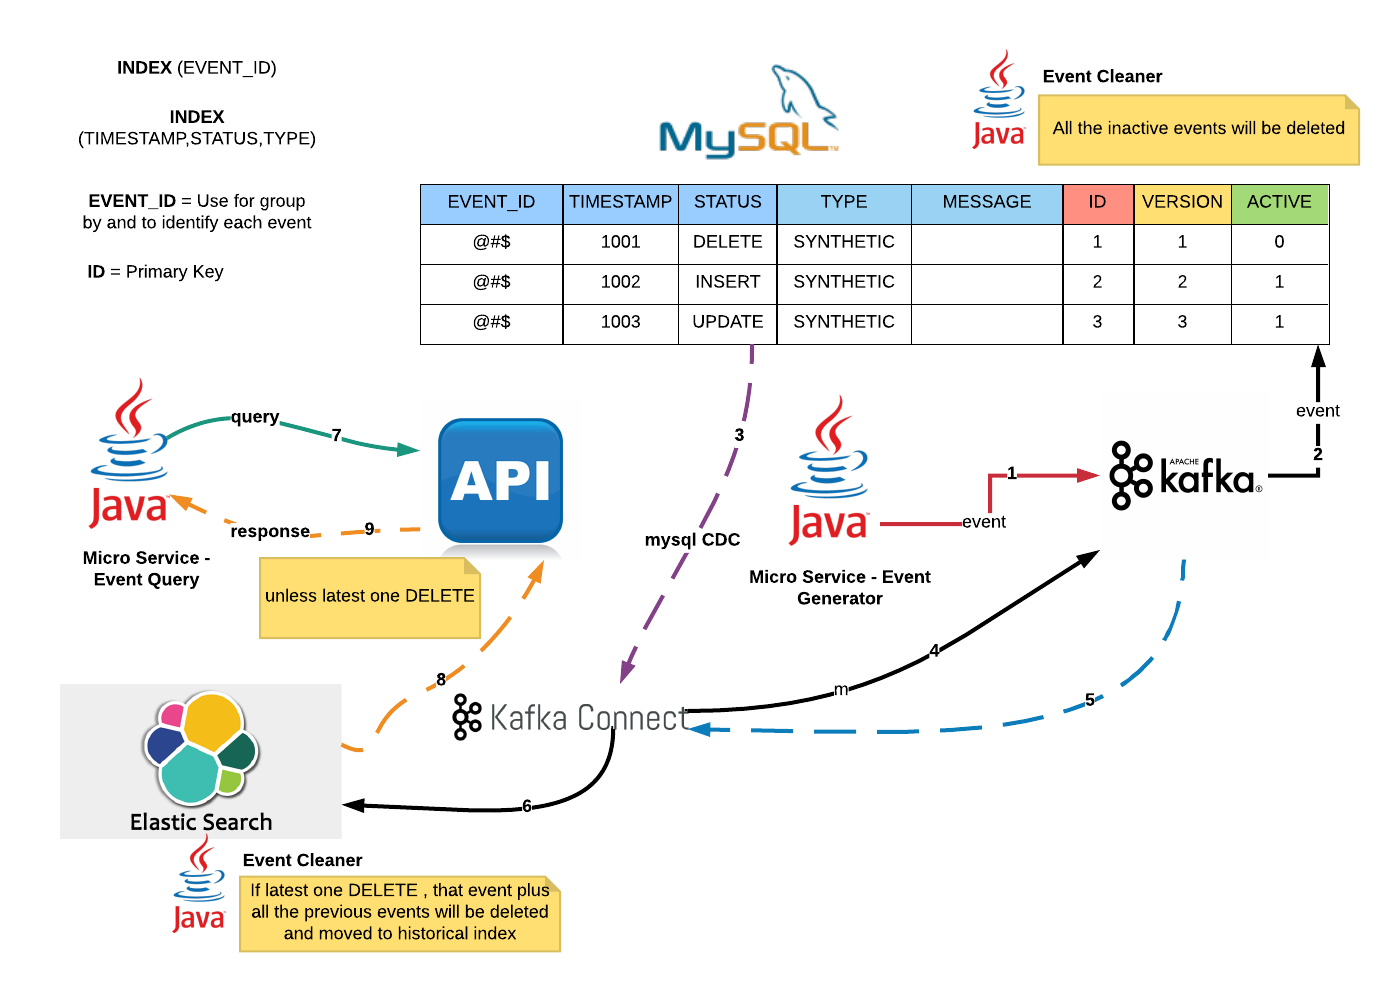
This is a hypothetical & high level architecture for Event Sourcing.

Key Architectural Considerations

1. Beyond Eventual Consistency.
2. Asynchronous.
3. Command Query Responsibility Segregation (CQRS).
4. Fault tolerant & Fail safe
5. Scalability.
6. Zero event lost & Exactly once.

Brief Explanation.

1. Micro-services application will publish events to Kafka.
2. Kafka consumer (sink connector) will consume and insert into Mysql Event Source table within a transactional context.
3. Mysql Change Data Capture (source connector) which runs within Kafka Connect will detect changes.
4. Kafka source connector will transform events and publish to Kafka.
5. Kafka connect will consume events from Kafka.
6. Elasticsearch sink connector will insert events into ES and update relevant MySql record activeness within transactional context.
7. Micro-Service query data from API.
8 & 9. API return latest data unless it's an DELETE event.

Events Cleaning

1. There are schedulers to clean/delete both MySQL and ES active index.
2. All the events will be rest in historical index.
3. MySQL events will be partitioned based on it's activeness.

7/30/2017

Sending Logs to ELK Stack through Logback


Sample Kibana Dashboard


Pre-Requirements & Steps to Setup

1. Java Application which already configured with Logback as Logging manager and use Groovy to configure Logback.

Sample Java Start up script 

java \
-Xms512m -Xmx1024m \
-XX:+HeapDumpOnOutOfMemoryError \
-XX:HeapDumpPath="/home/uranadh/opensource/kafka_connect_config/heap-dump.hprof" \
-cp "distributed-services-1.0.0.jar:lib/*" \
 -Dlogback.configurationFile=/home/uranadh/opensource/kafka_connect_config/logback.groovy  \
 org.reactor.monitoring.application.internal.Member

2. Configure logback.groovy file with Logstash Appender.

Please note here we use below Logstash  TCP Appender.

https://github.com/logstash/logstash-logback-encoder#pattern-json-provider

Groovy file


import ch.qos.logback.classic.AsyncAppender;
import ch.qos.logback.classic.encoder.PatternLayoutEncoder;
import ch.qos.logback.core.FileAppender;

import static ch.qos.logback.classic.Level.DEBUG;
import static ch.qos.logback.classic.Level.INFO;

import org.slf4j.LoggerFactory;
import ch.qos.logback.classic.Level;
import ch.qos.logback.classic.Logger;
import ch.qos.logback.core.rolling.RollingFileAppender;
import ch.qos.logback.core.rolling.TimeBasedRollingPolicy;
import ch.qos.logback.core.util.FileSize;
import net.logstash.logback.appender.LogstashTcpSocketAppender
import net.logstash.logback.encoder.LogstashEncoder


appender("STASH", LogstashTcpSocketAppender) {
  println "Setting [destination] property to 127.0.0.1:5000"
  destination =  "127.0.0.1:5000" 
  encoder(LogstashEncoder) {
   
  }
}

appender("ASYNC", AsyncAppender) {
  discardingThreshold=0;
  queueSize=500;
  neverBlock=true;
  appenderRef("STASH");
}

//root(DEBUG, ["ASYNC"])
root(INFO, ["ASYNC"])

logger("org.reactor.monitoring", DEBUG,["STASH"],false)

 3. Install ElasticSearch & Run

https://www.elastic.co/downloads/elasticsearch

elasticsearch-5.5.0/bin$ ./elasticsearch


 4. Install, Configure & Run Logstash


https://www.elastic.co/guide/en/logstash/current/installing-logstash.html

 Sample Logstash Configuration- logstash-filter.conf


input { 
  tcp {
   port => 5000
   codec => "json"
  }
}

filter {
  grok {
    match => { "message" => "%{COMBINEDAPACHELOG}" }
  }
  date {
    match => [ "timestamp" , "dd/MMM/yyyy:HH:mm:ss Z" ]
  }
}

output {
  elasticsearch { hosts => ["localhost:9200"]
          index => "dlogs-%{+YYYY.MM.dd}"
          document_type => "log"
           
         }
  stdout { codec => rubydebug }
}

Run Logstash

logstash-5.5.1$ bin/logstash -f logstash-filter.conf


Sample Console Output

{
     "@timestamp" => 2017-07-30T15:28:37.792Z,
          "level" => "INFO",
           "port" => 52778,
    "thread_name" => "hz.ShutdownThread",
    "level_value" => 20000,
       "@version" => 1,
           "host" => "127.0.0.1",
    "logger_name" => "com.hazelcast.core.LifecycleService",
        "message" => "[10.180.35.234]:8701 [hibernate] [3.7.3] [10.180.35.234]:8701 is SHUTDOWN",
           "tags" => [
        [0] "_grokparsefailure"
    ]
}


 5. Insall & Run Kibana

https://www.elastic.co/guide/en/kibana/current/install.html

kibana-5.5.1-linux-x86_64$ ./bin/kibana 

6. Go to Kibana Dashboard

http://localhost:5601/app/kibana#/discover?_g=(refreshInterval:(display:Off,pause:!f,value:0),time:(from:now-15m,mode:quick,to:now))&_a=(columns:!(_source),index:'dlogs-*',interval:auto,query:(query_string:(analyze_wildcard:!t,query:'*')),sort:!('@timestamp',desc))